Software Tools: Examples and Screenshots
IN THIS SECTION, YOU WILL: See a few screenshots of concrete tools I built as a part of Lightweight Architectural Analytics websites.
This appendix shows what Lightweight Architectural Analytics looks like in practice. The screenshots are not included as decoration; they are meant to make the earlier discussion of dashboards, source-code analysis, and architectural visibility more tangible.
Dashboards
Here are screenshots from Lightweight Architectural Analytics websites I built at AVIV Group (Figure 1) and eBay Classifieds (Figure 2):
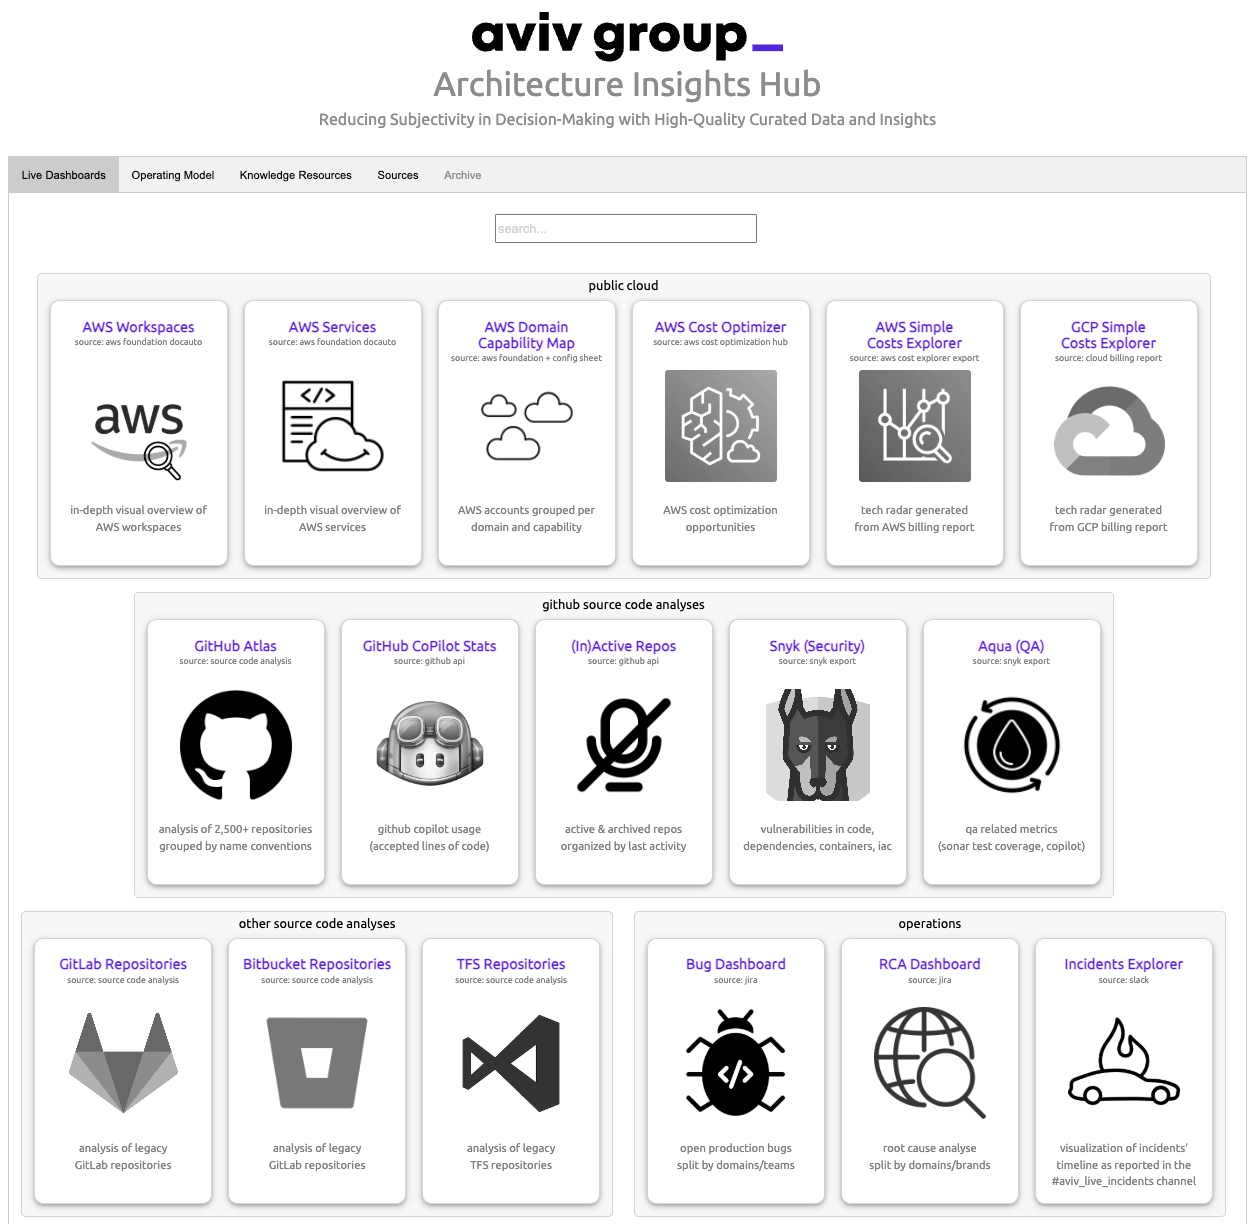
Figure 1: A screenshot of the start page of the architecture data dashboard we built and used at AVIV Group.
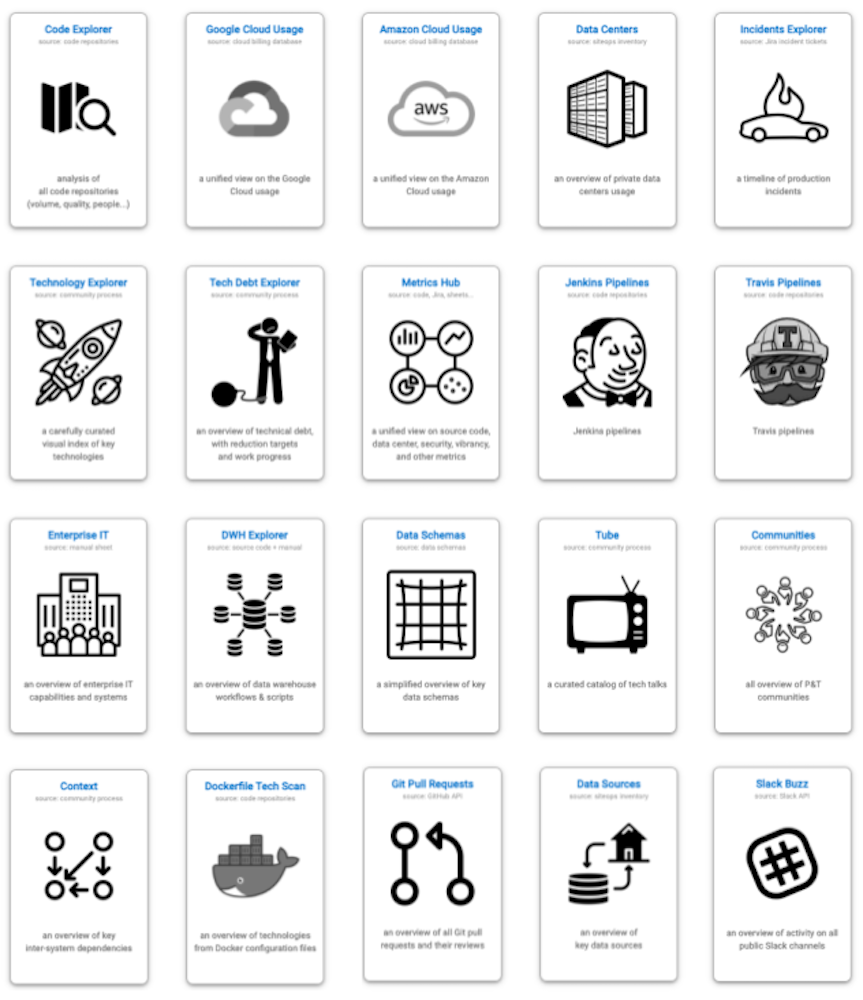
Figure 2: A screenshot of the start page of the architecture data dashboard we built and used at eBay Classifieds.
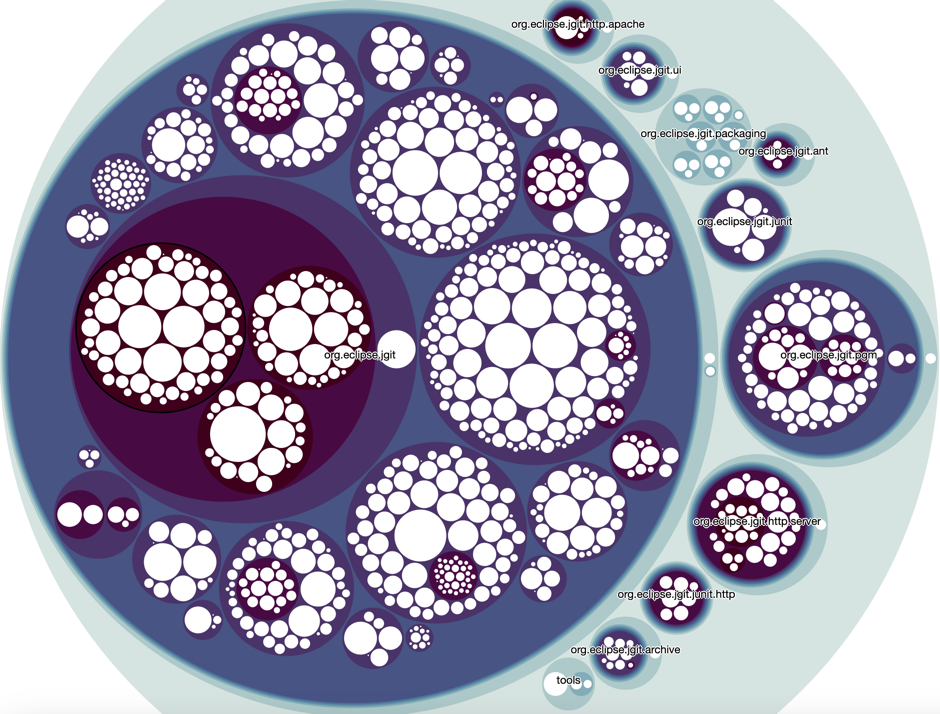
Examples of Insights From Source Code Analyses
Source code and commit history are rich sources for data-driven architecture documentation. They reveal information about technologies, team activity, dependencies, and software quality. To help extract these insights, I developed and actively maintain Sokrates.
Sokrates is designed to let you zoom in and out of source code landscapes. It provides a high-level overview of the IT landscape while also allowing detailed inspection down to repository and code level. That makes it useful for both strategic discussions and technical reviews.
Figures 3 to 7 show some insights from source code analyses with Sokrates.
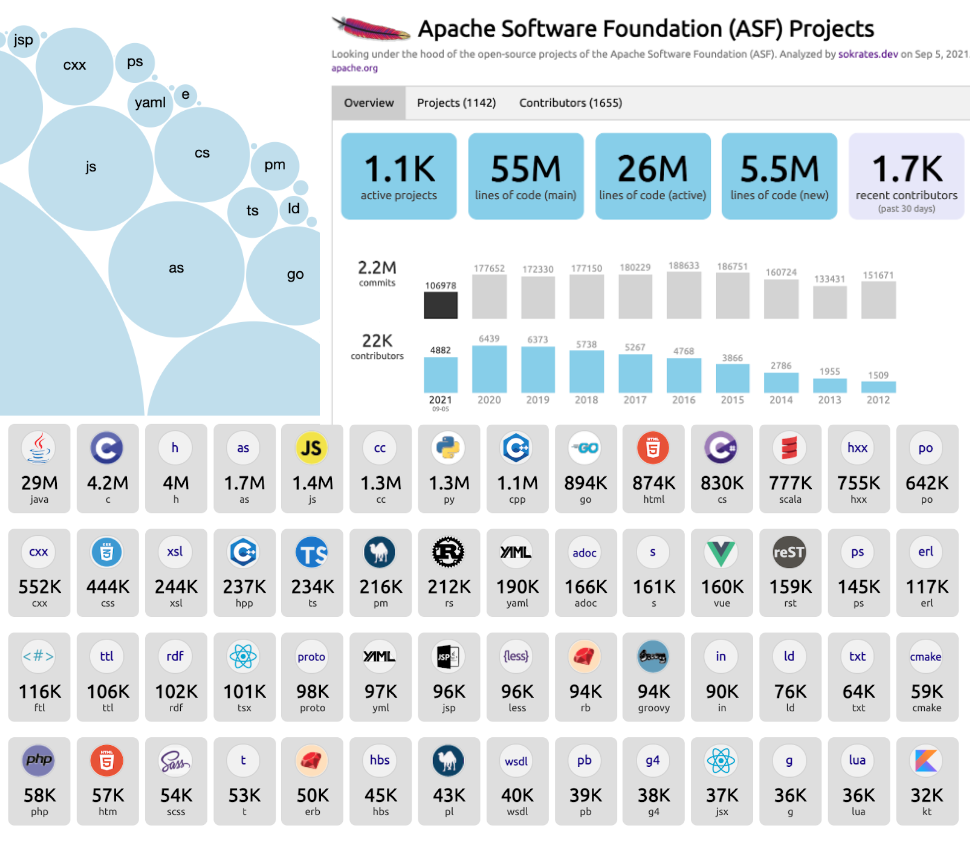
Figure 3: Sokrates can instantly create a helicopter view of the technology landscape, programming languages, active contributors, and commit trends.
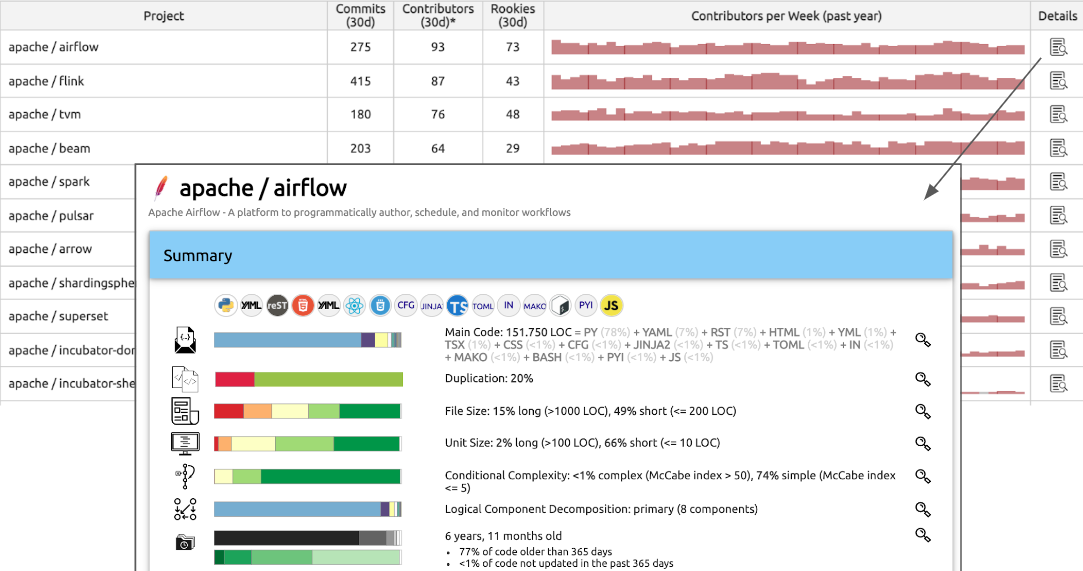
Figure 4: Sokrates can show detailed code and contributors’ trends per repository, enabling zooming in each repository up to the code level.
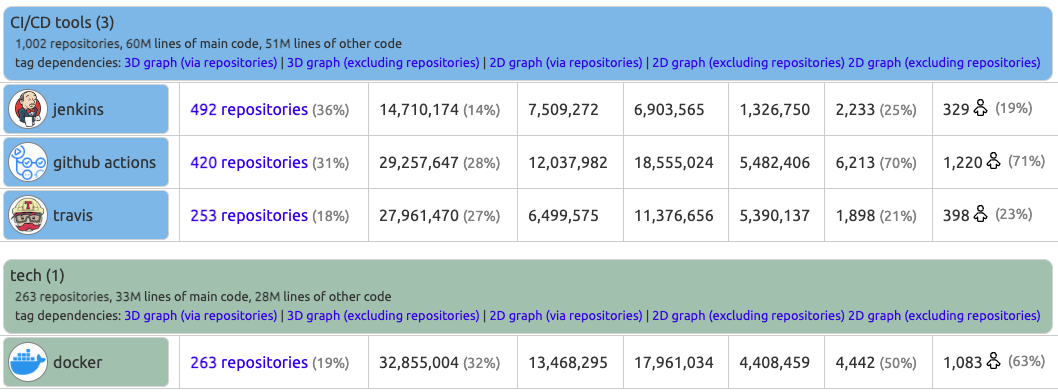
Figure 5: Sokrates can create a tech radar by tagging projects with identified technologies.
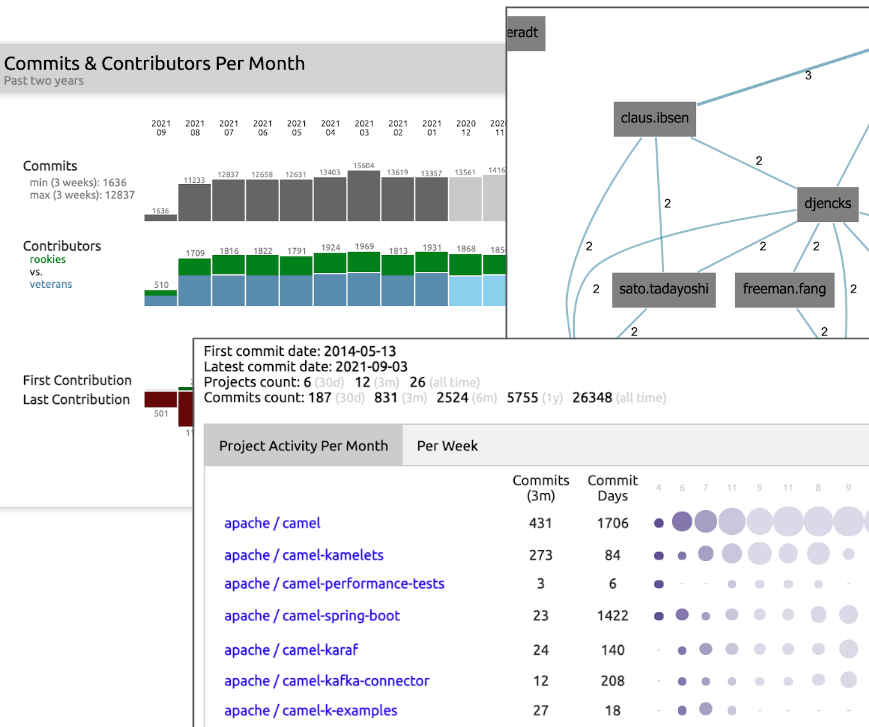
Figure 6: Sokrates can show contributor trends, distribution of “veterans” and “rookies,” and dependencies between people and repositories, enabling zooming in into patterns of the contribution of individual contributors.

Figure 7: Sokrates can reveal the team topologies by plotting 2D and 3D graphs of dependencies that people create through working on the same repositories in the same period.

Figure 8: Example architecture practice key performance indicators (KPIs) dashboard, generated from a JSON configuration file.
Appendix 6: Software Tools |
|||
| ← | → | ||